
Omoru: building a Shopify store
Introduced AI into a small venture's workflow by rebuilding Shopify templates and fixing its analytics. Engagement time per session more than doubled.
2026
- Role
- AI Builder
- Stack
- Outcome
- Engagement time per session up from 34 seconds to 1 minute 28 seconds, and basket and checkout now visible in Google Analytics 4 (GA4)





The shift
Omoru (opens in a new tab) is a small Shopify store selling dog toys, clothing and accessories in Singapore. Most of the owner's week went to counting inventory and patching the theme, not to the products or the shoppers. The goal was to bring AI into how the store runs, so that time goes back to the store itself.
Most of my AI work is at ShopBack, a large organisation. This is the other end of the scale: one small business, and the question is what AI changes in its day.
What made it hard
- Root cause. The theme had technical problems that Shopify Sidekick, the AI built into Shopify, could not fix, so the homepage surfaced few products and the experience stayed poor. GA4 tracked only part of the site.
- Consequence. Nobody could see basket size or checkout flow, so nobody could see where shoppers dropped. The owner's time kept going on inventory counts and template fixes.
- Constraint. The store was live, so every change reached real shoppers, and any tracking had to stay within the cookie rules of Singapore's Personal Data Protection Act (PDPA).
What I did
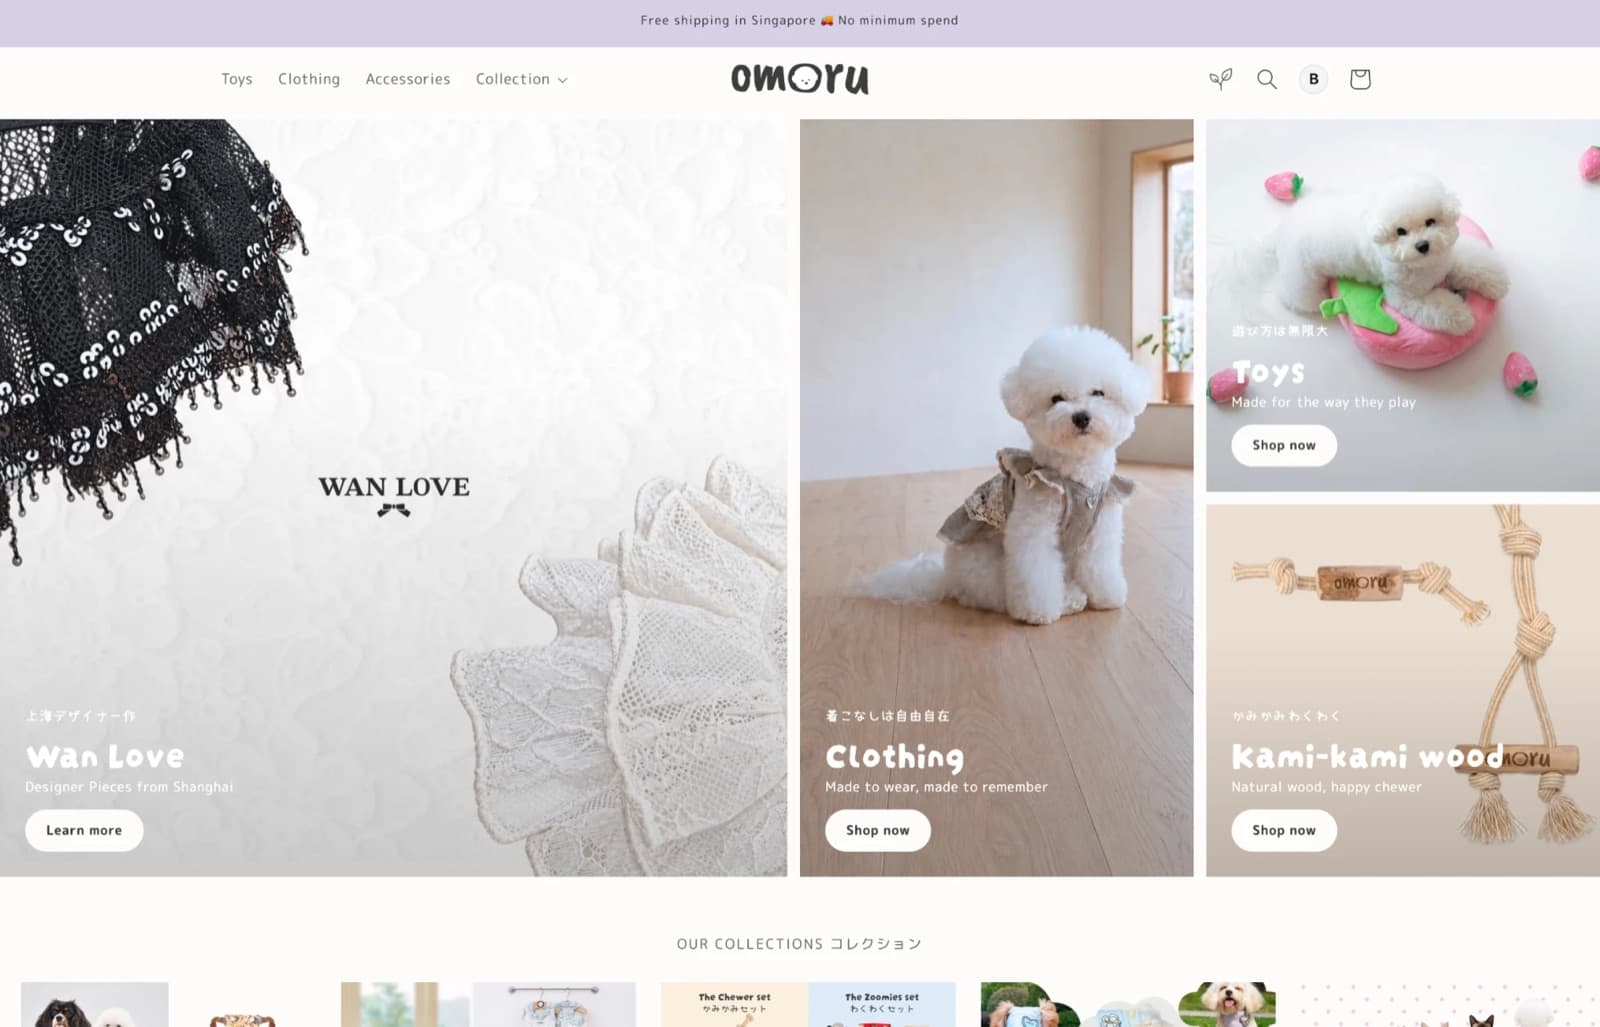
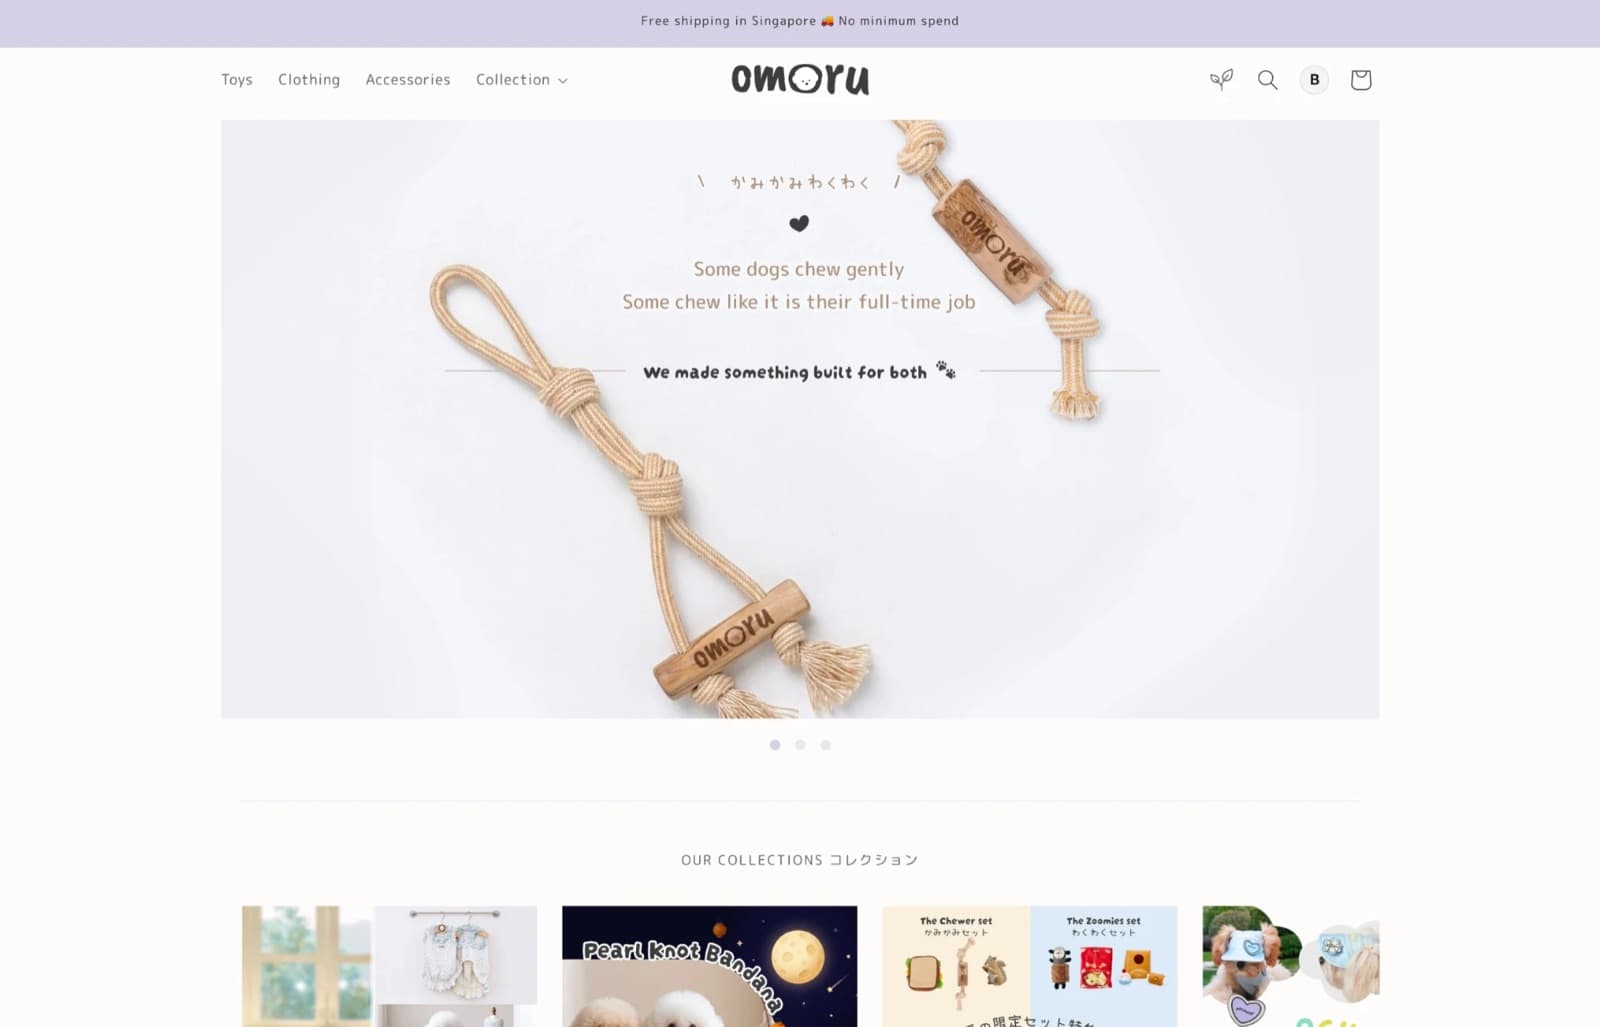
I introduced AI in three steps. First, I used AI to build new theme components in Shopify Liquid, so the first flow surfaces more products. They include a scrolling marquee that links into each collection, New and Sale tags that the store applies to products by itself and logs every time, a homepage refresh, collection navigation and quick views.
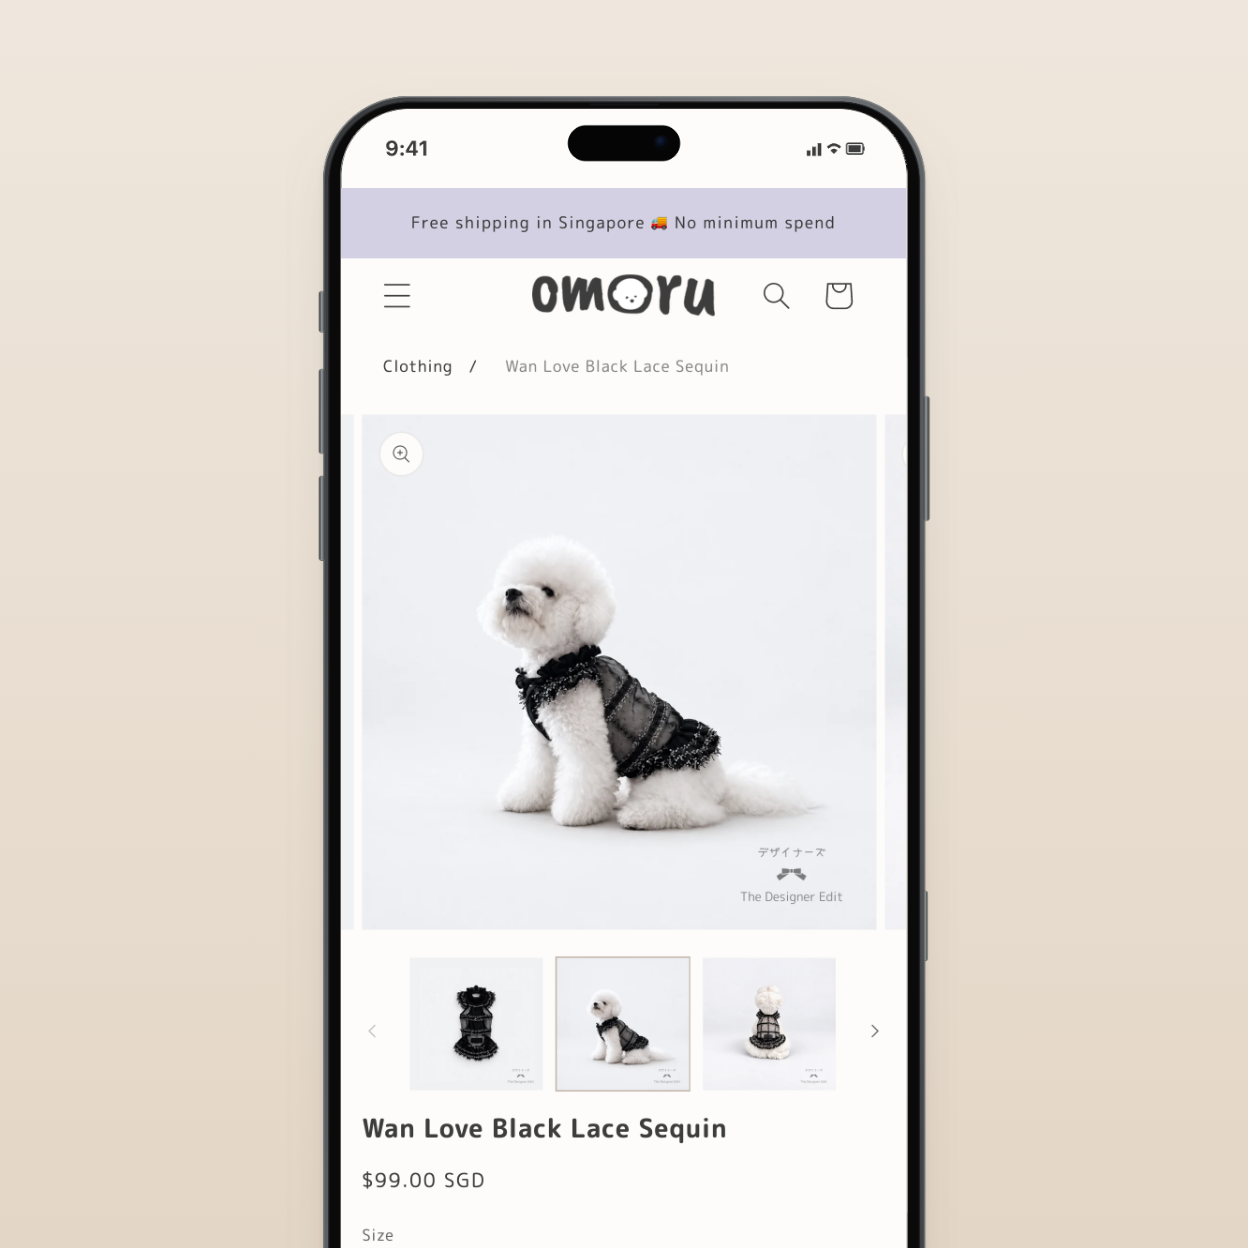
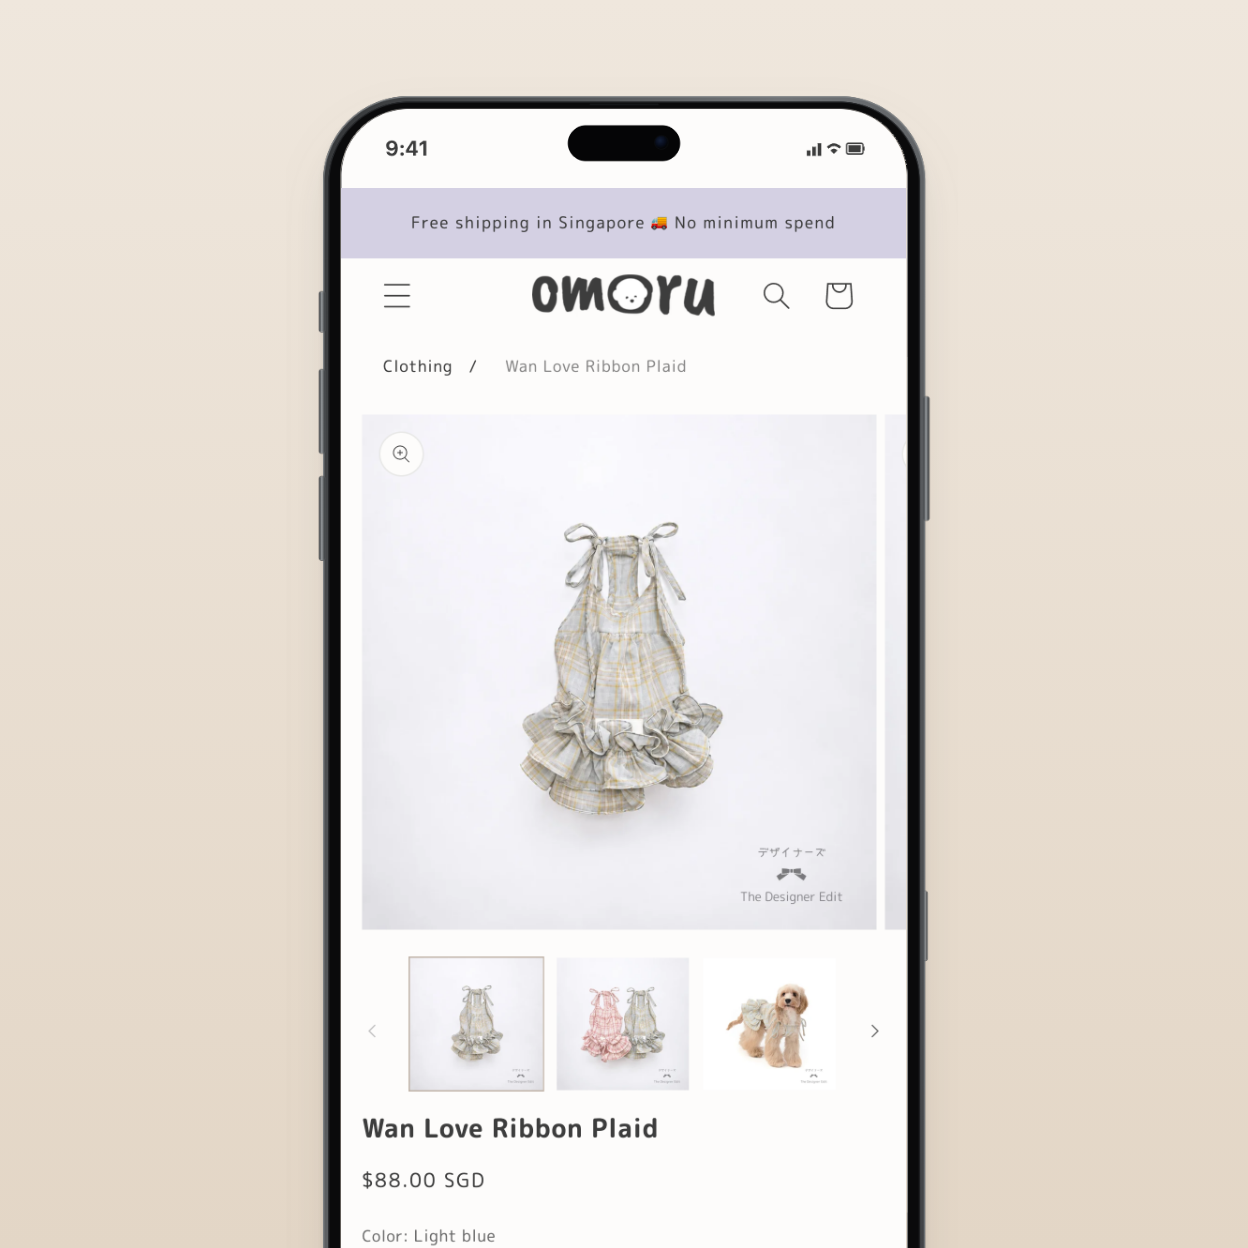
Second, I fixed the GA4 tagging with Google Tag Manager, and I learned the PDPA cookie rules so tracking stays within them.
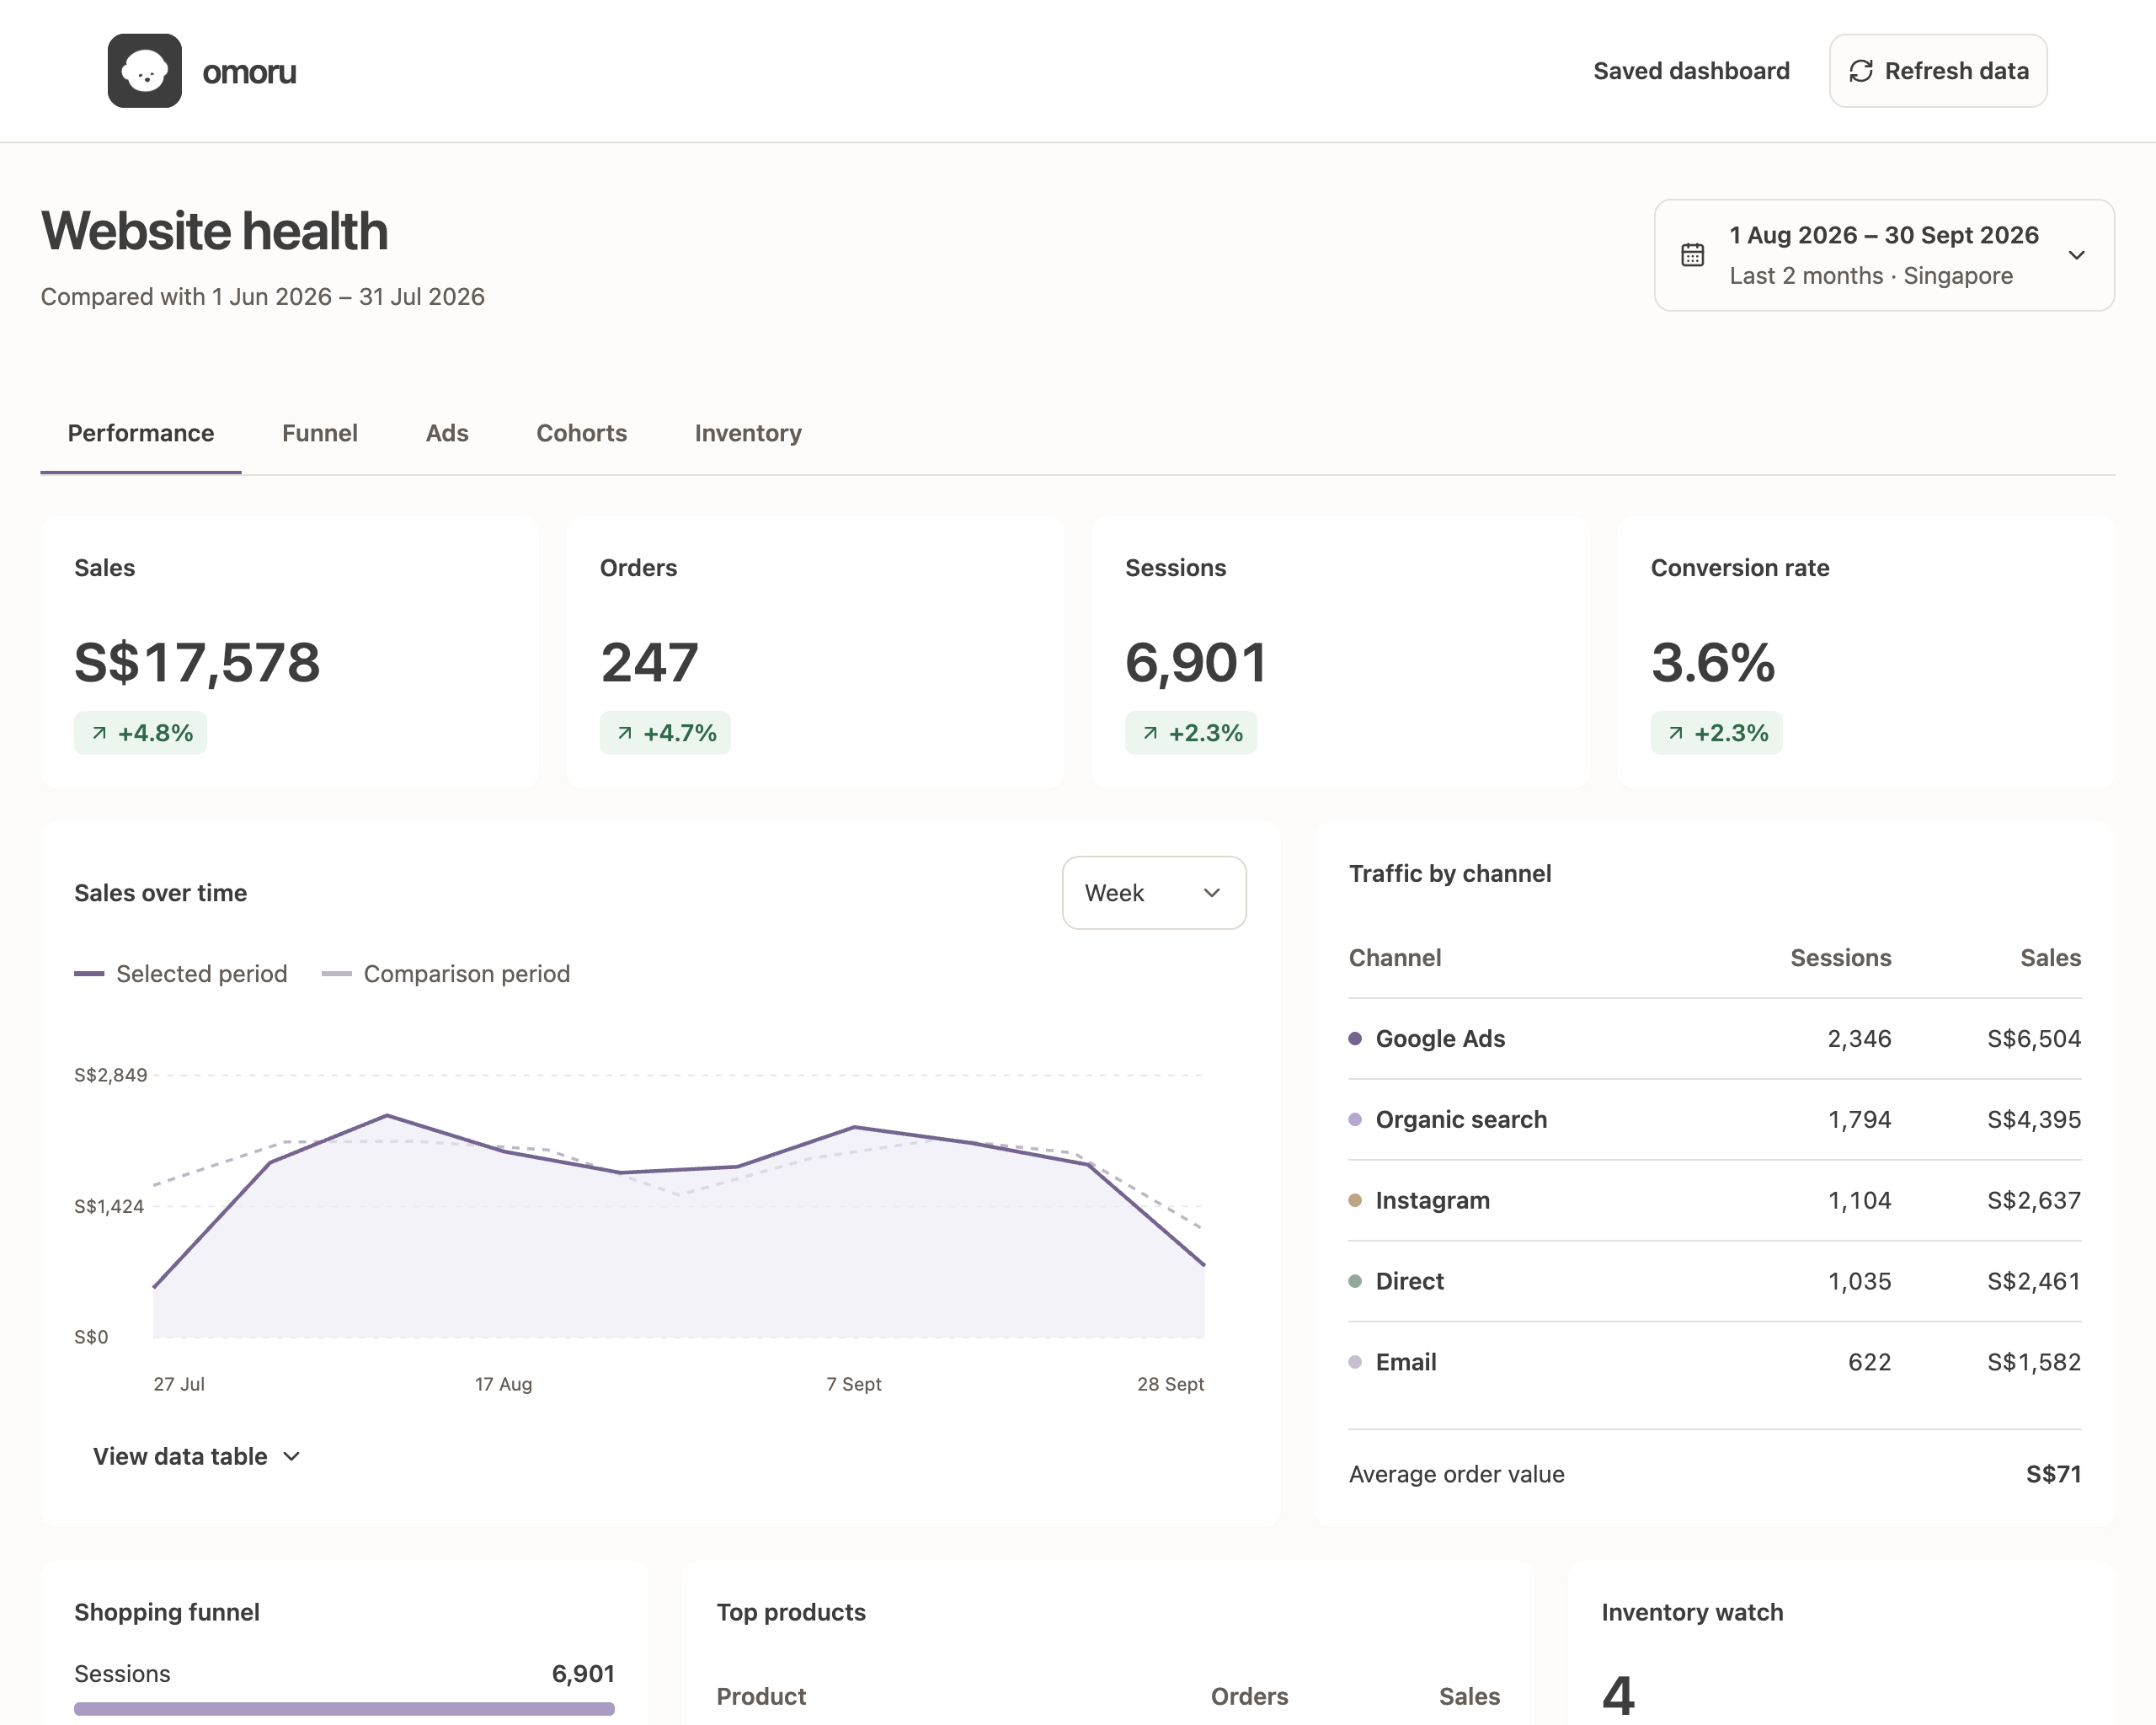
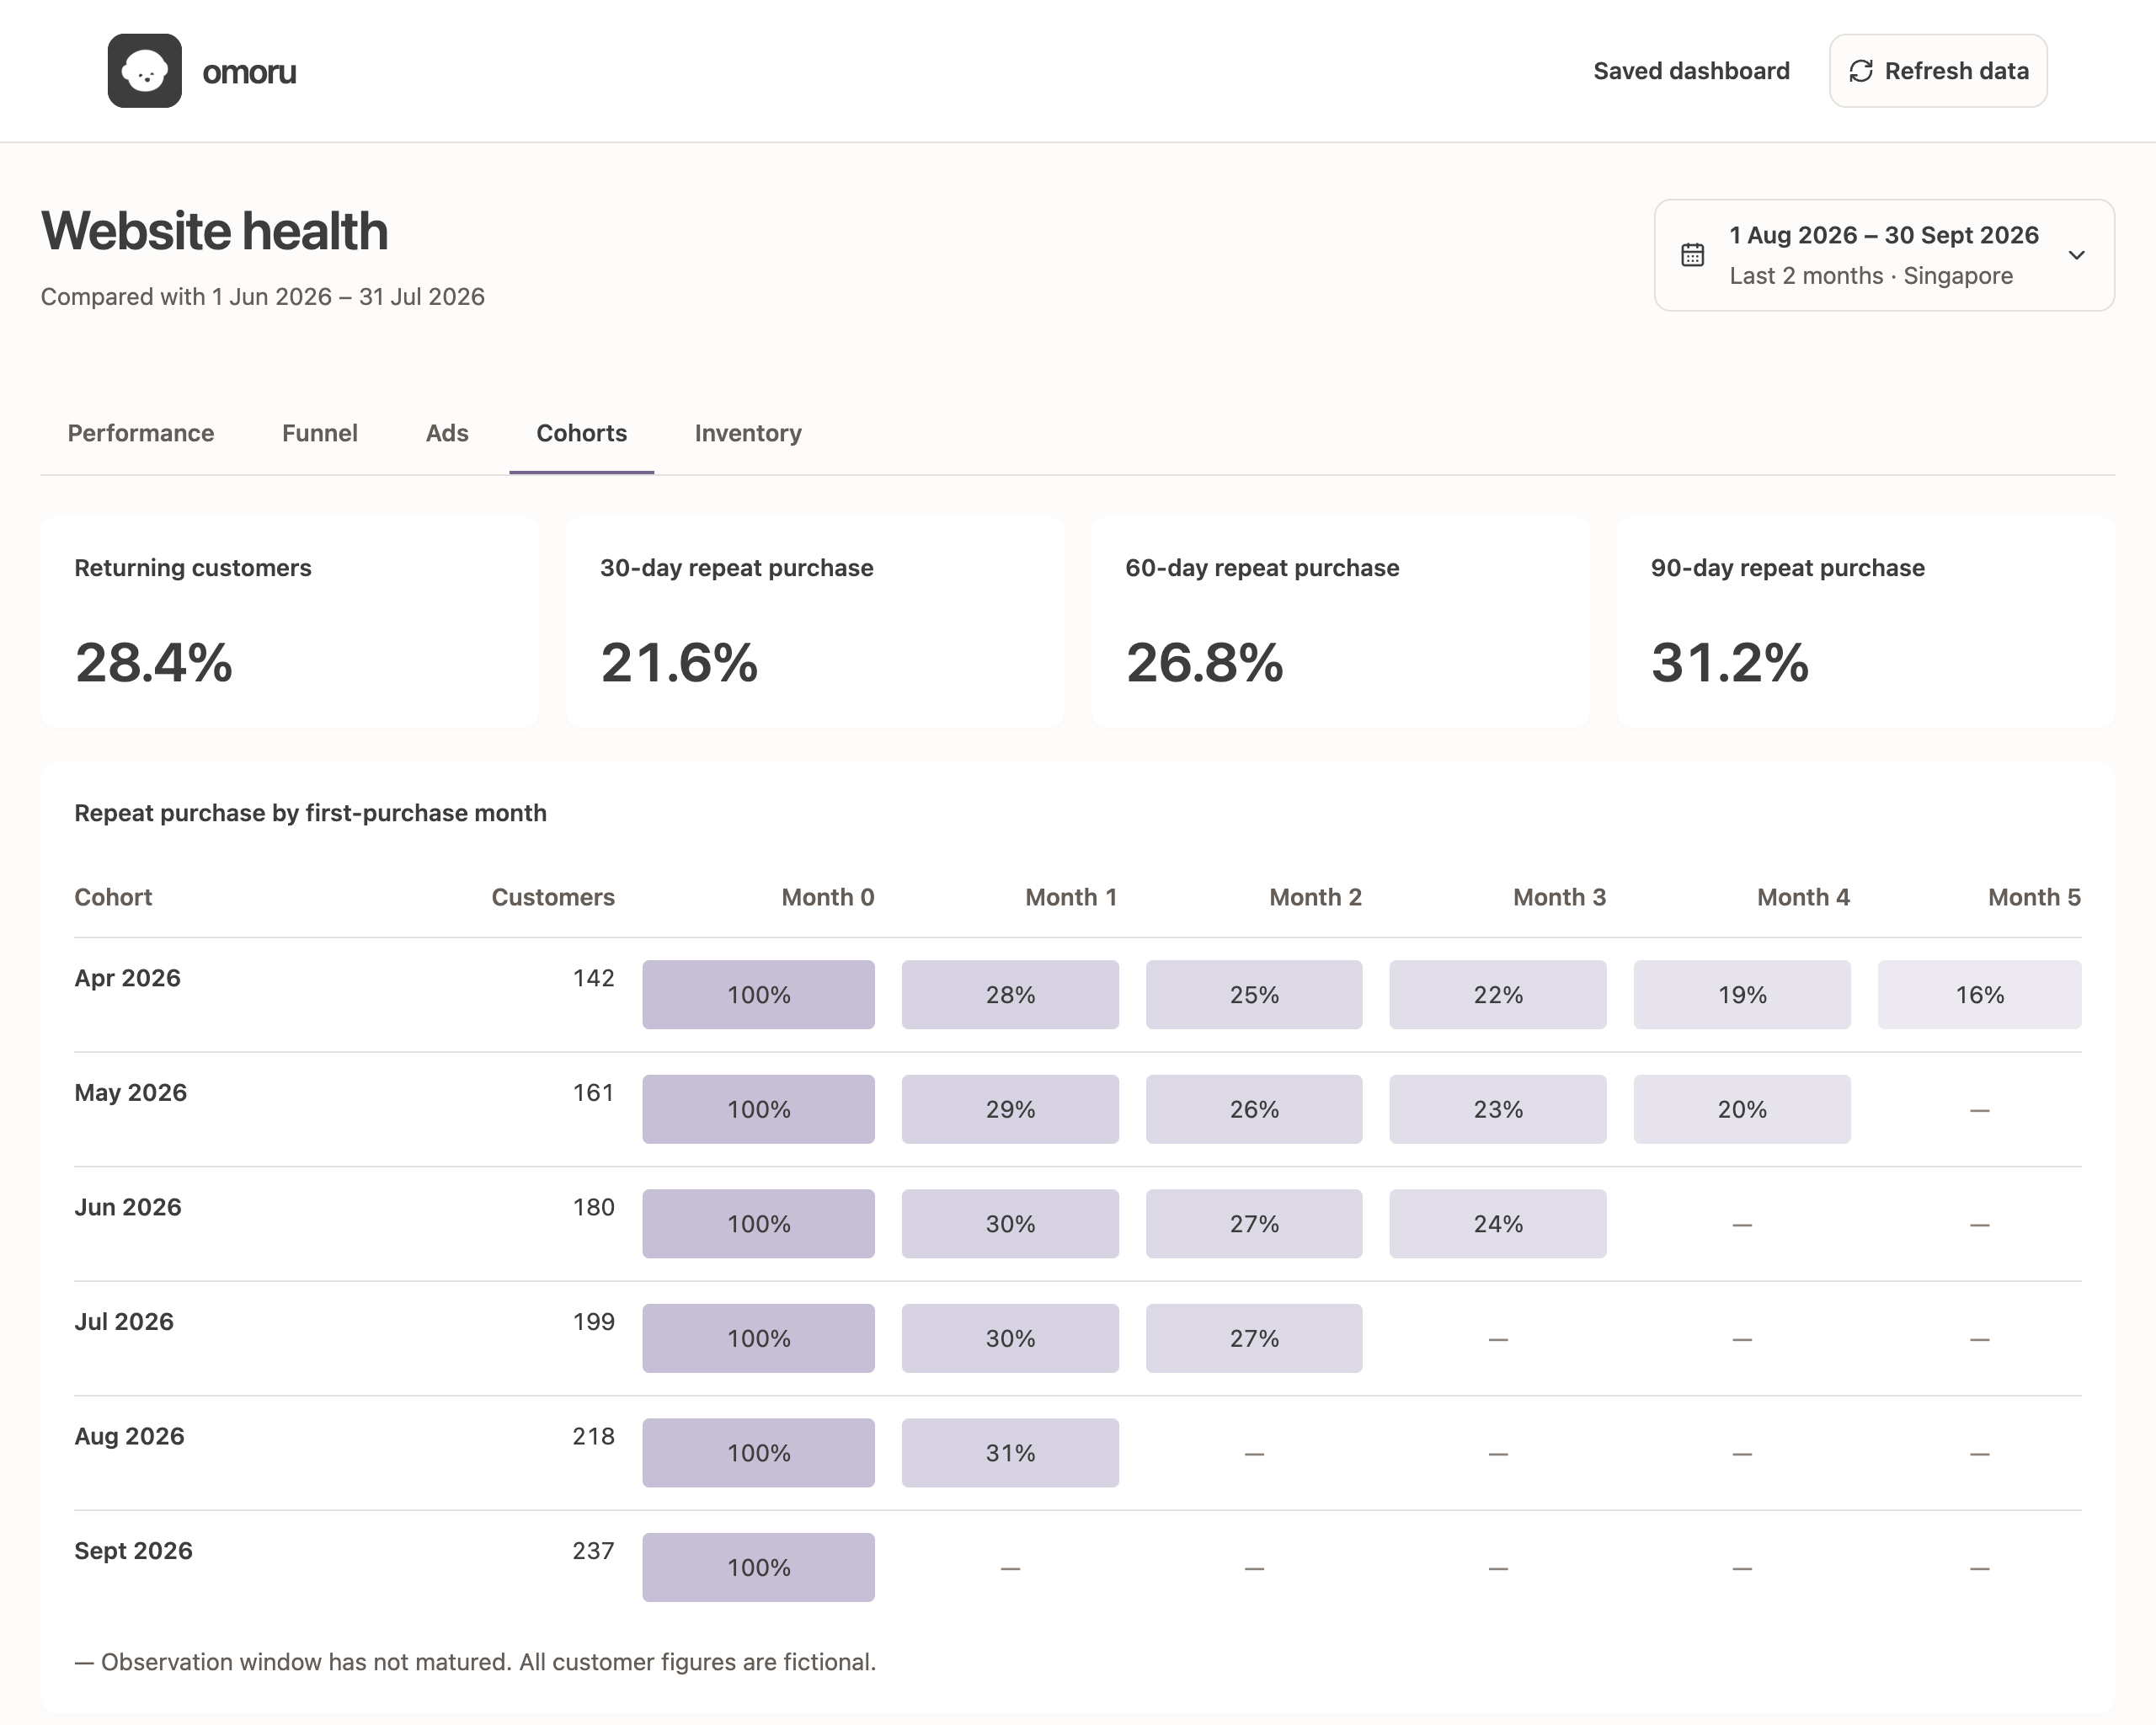
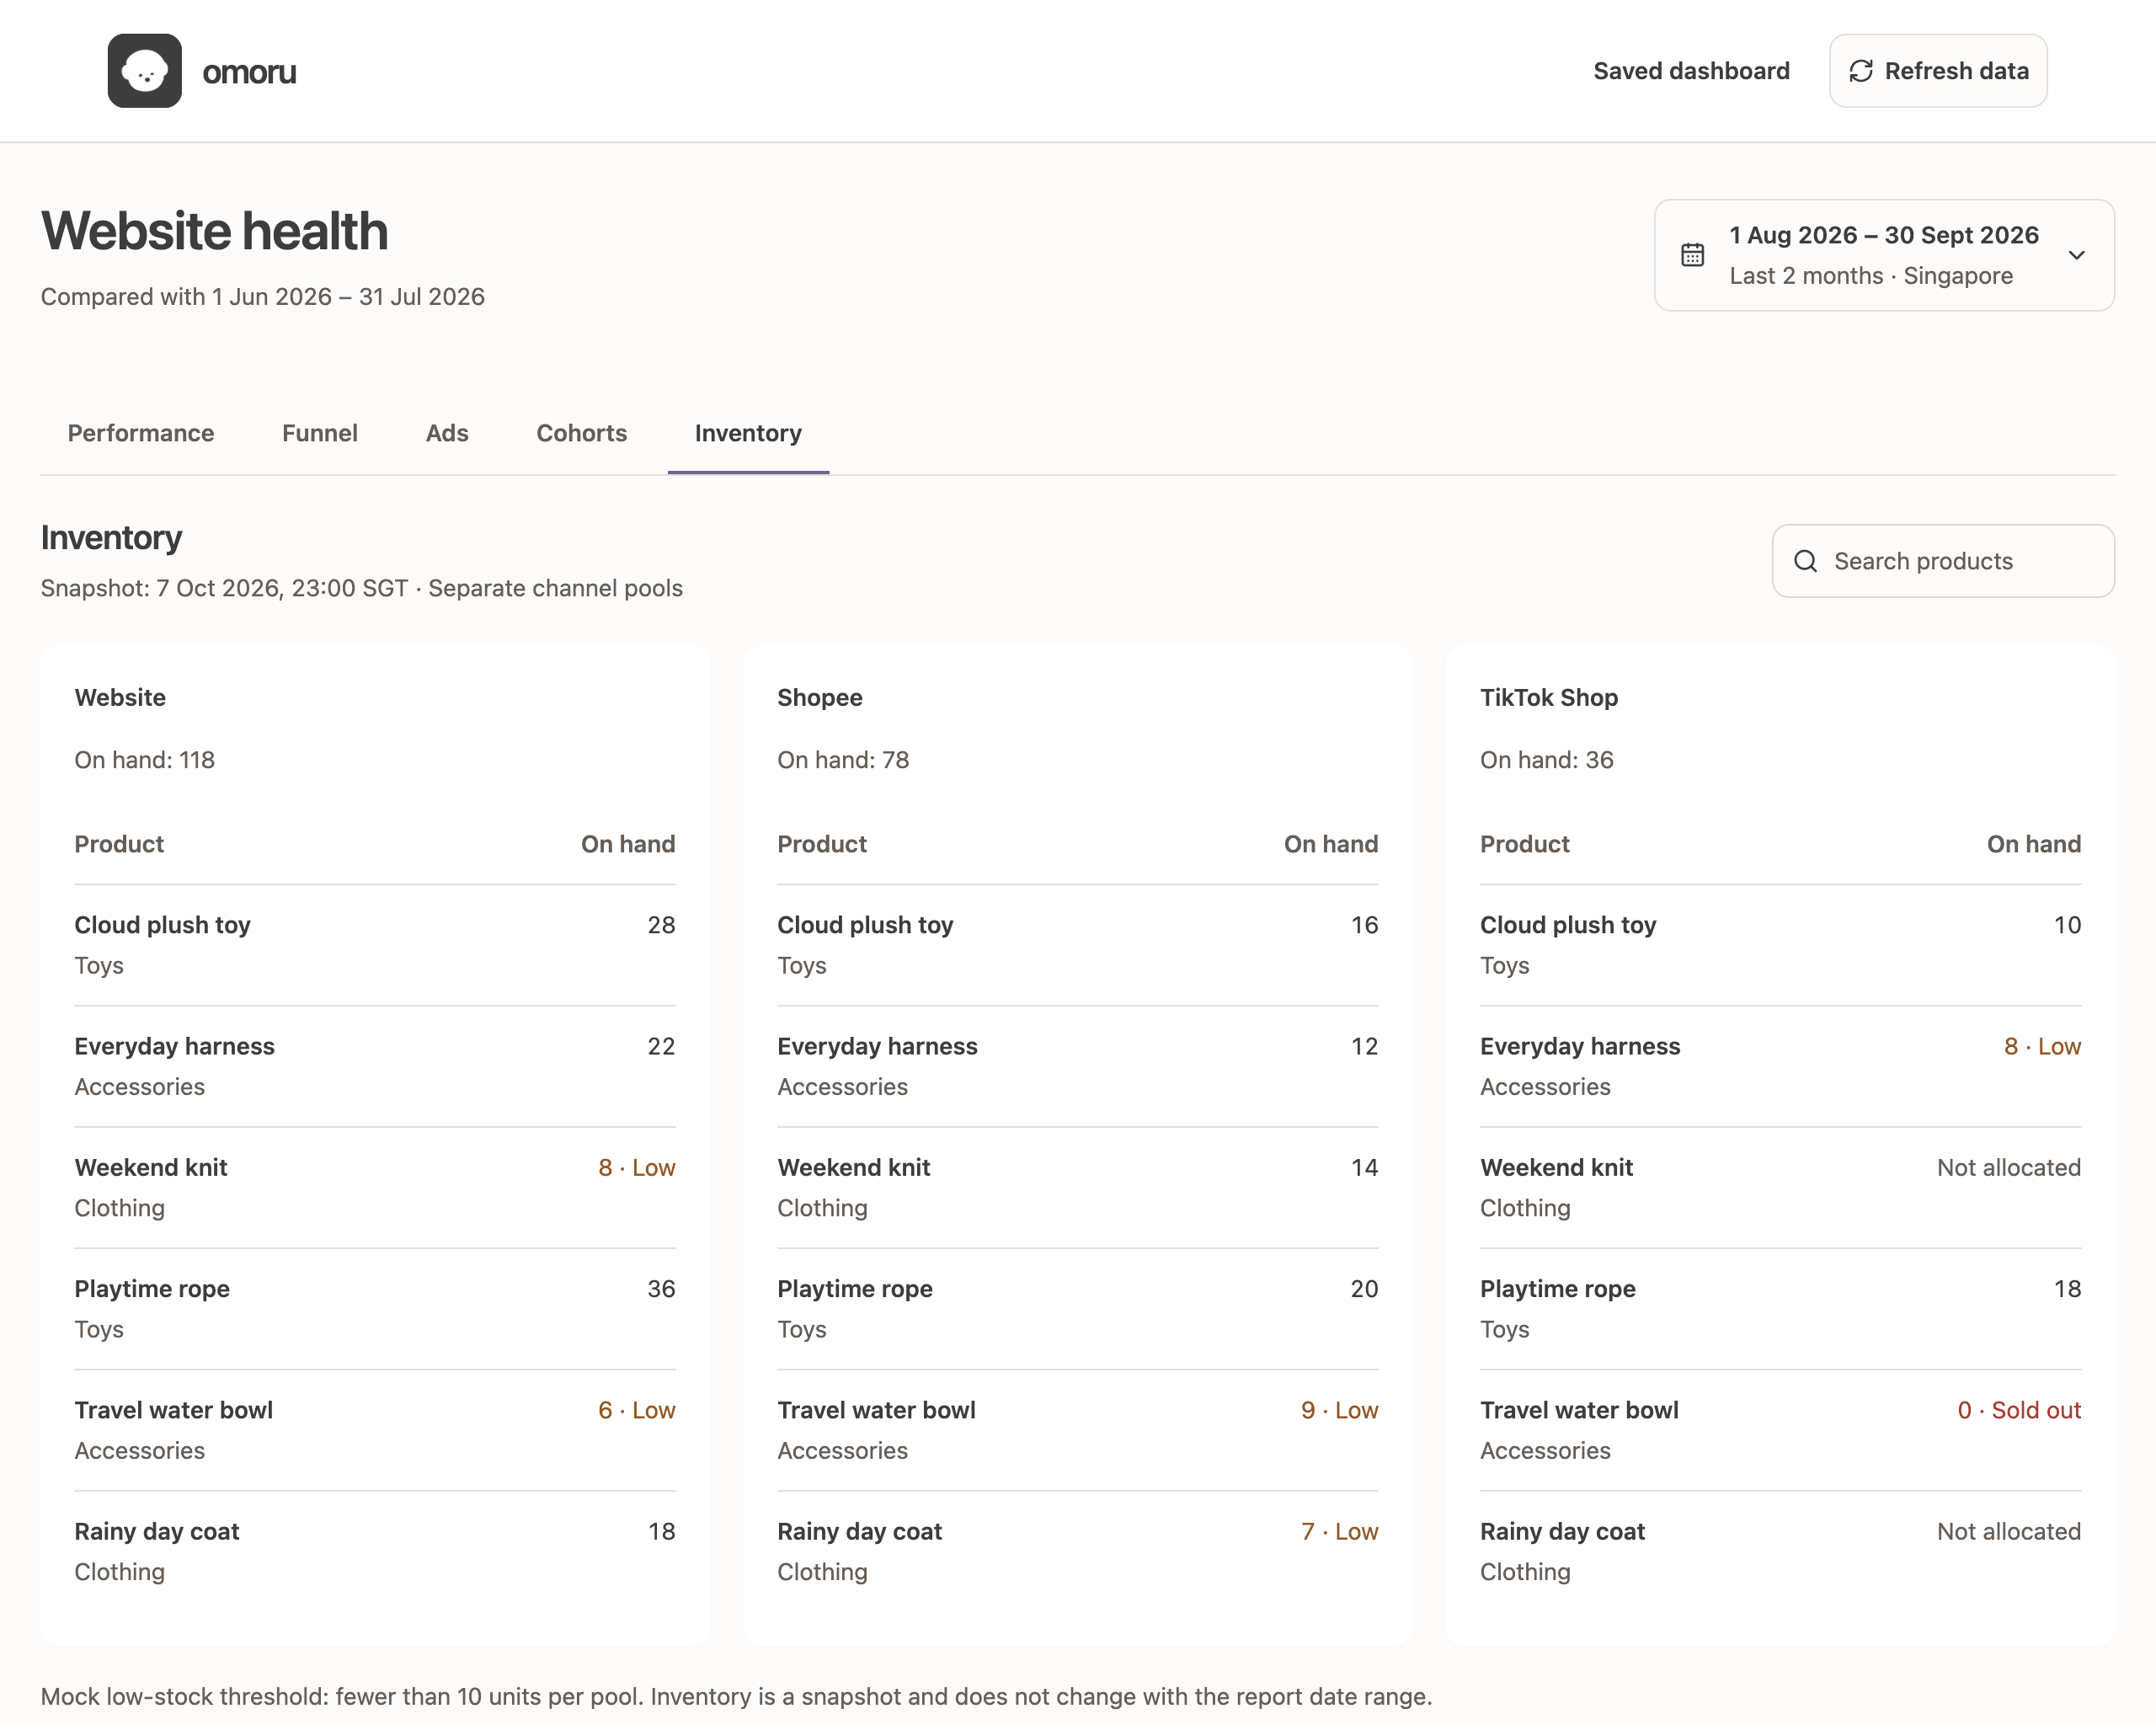
Third, I built the owner one dashboard that joins GA4, ad spend and stock across the website, Shopee and TikTok Shop, so a low pool on one channel shows before it sells out, instead of the owner checking three back offices and a sheet.
What changed
- Sessions rose from 277 to 426 between 21 August to 10 September and 11 September to 1 October. Engaged sessions rose from 115 to 208, and average engagement time per session from 34 seconds to 1 minute 28 seconds.
- Basket size and checkout flow, which were blind before, have been tracked in GA4 since 3 October, so there is no data on them yet.
- The GA4 fix went live on 3 October, after both periods, so it does not explain the change in engagement.
- The sample is small, and the latest week's gain is partly traffic mix, so I read this as a direction and not proof.